
Financial Model
From operating expenses to margins, Vornoy helps you understand the financial engine driving your business — in real time.
Understand your company’s Financial Model more clearly.
See the structure behind the scenes.
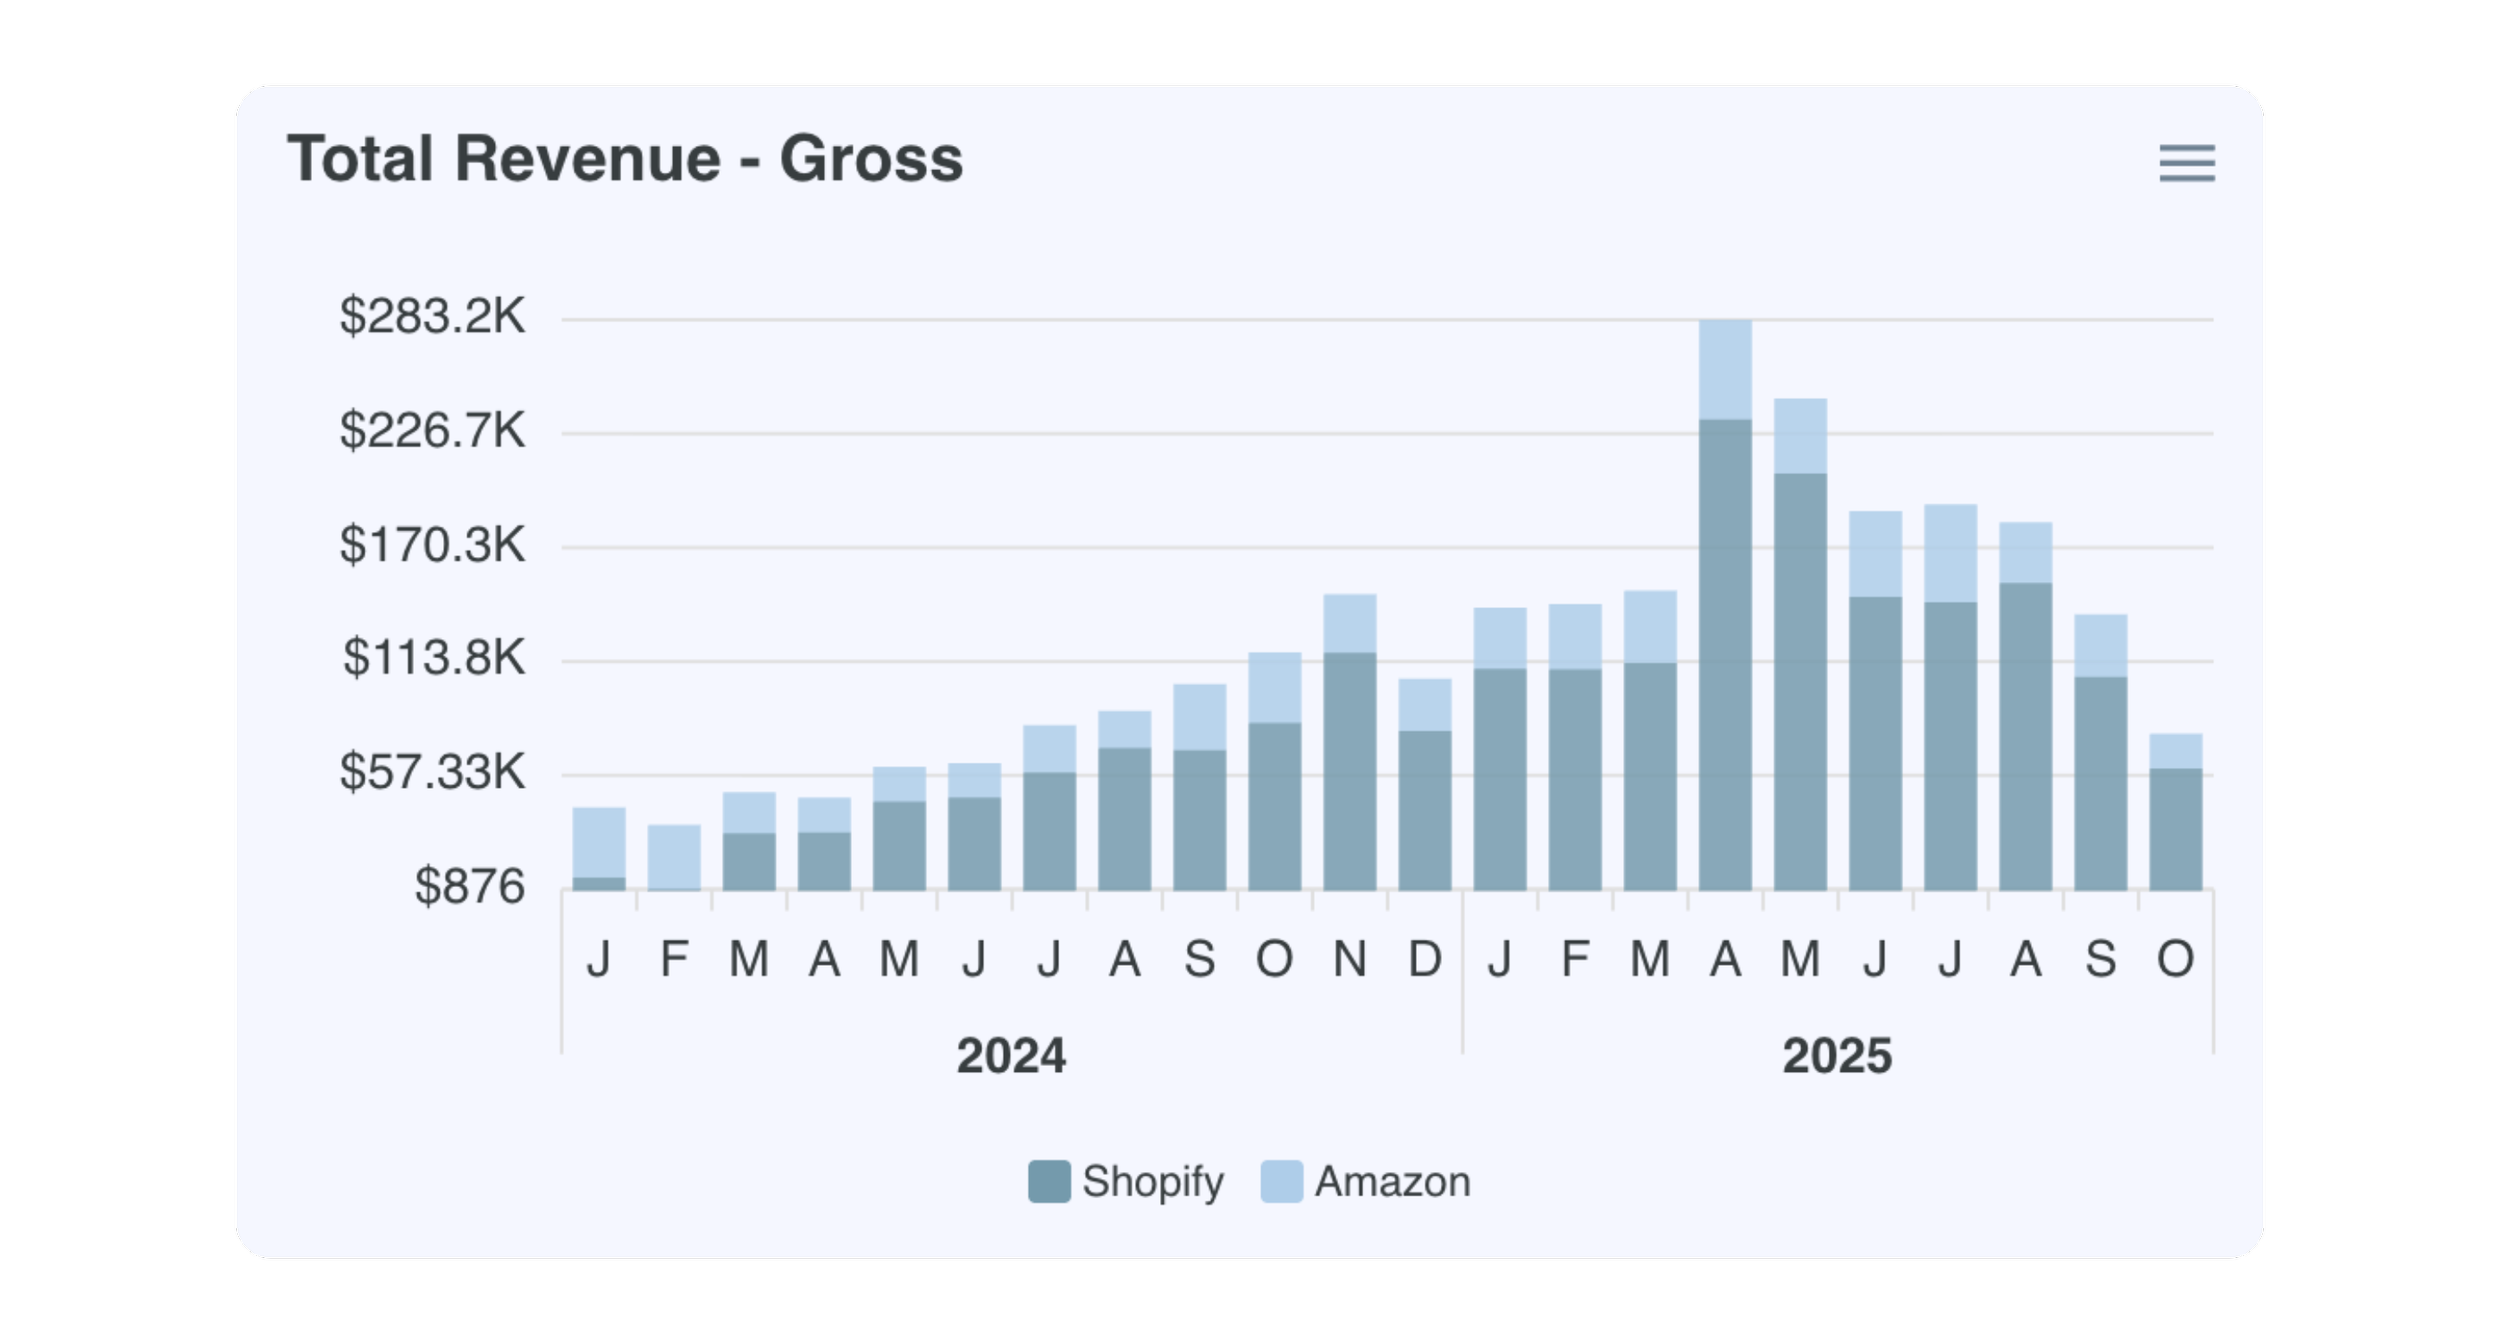
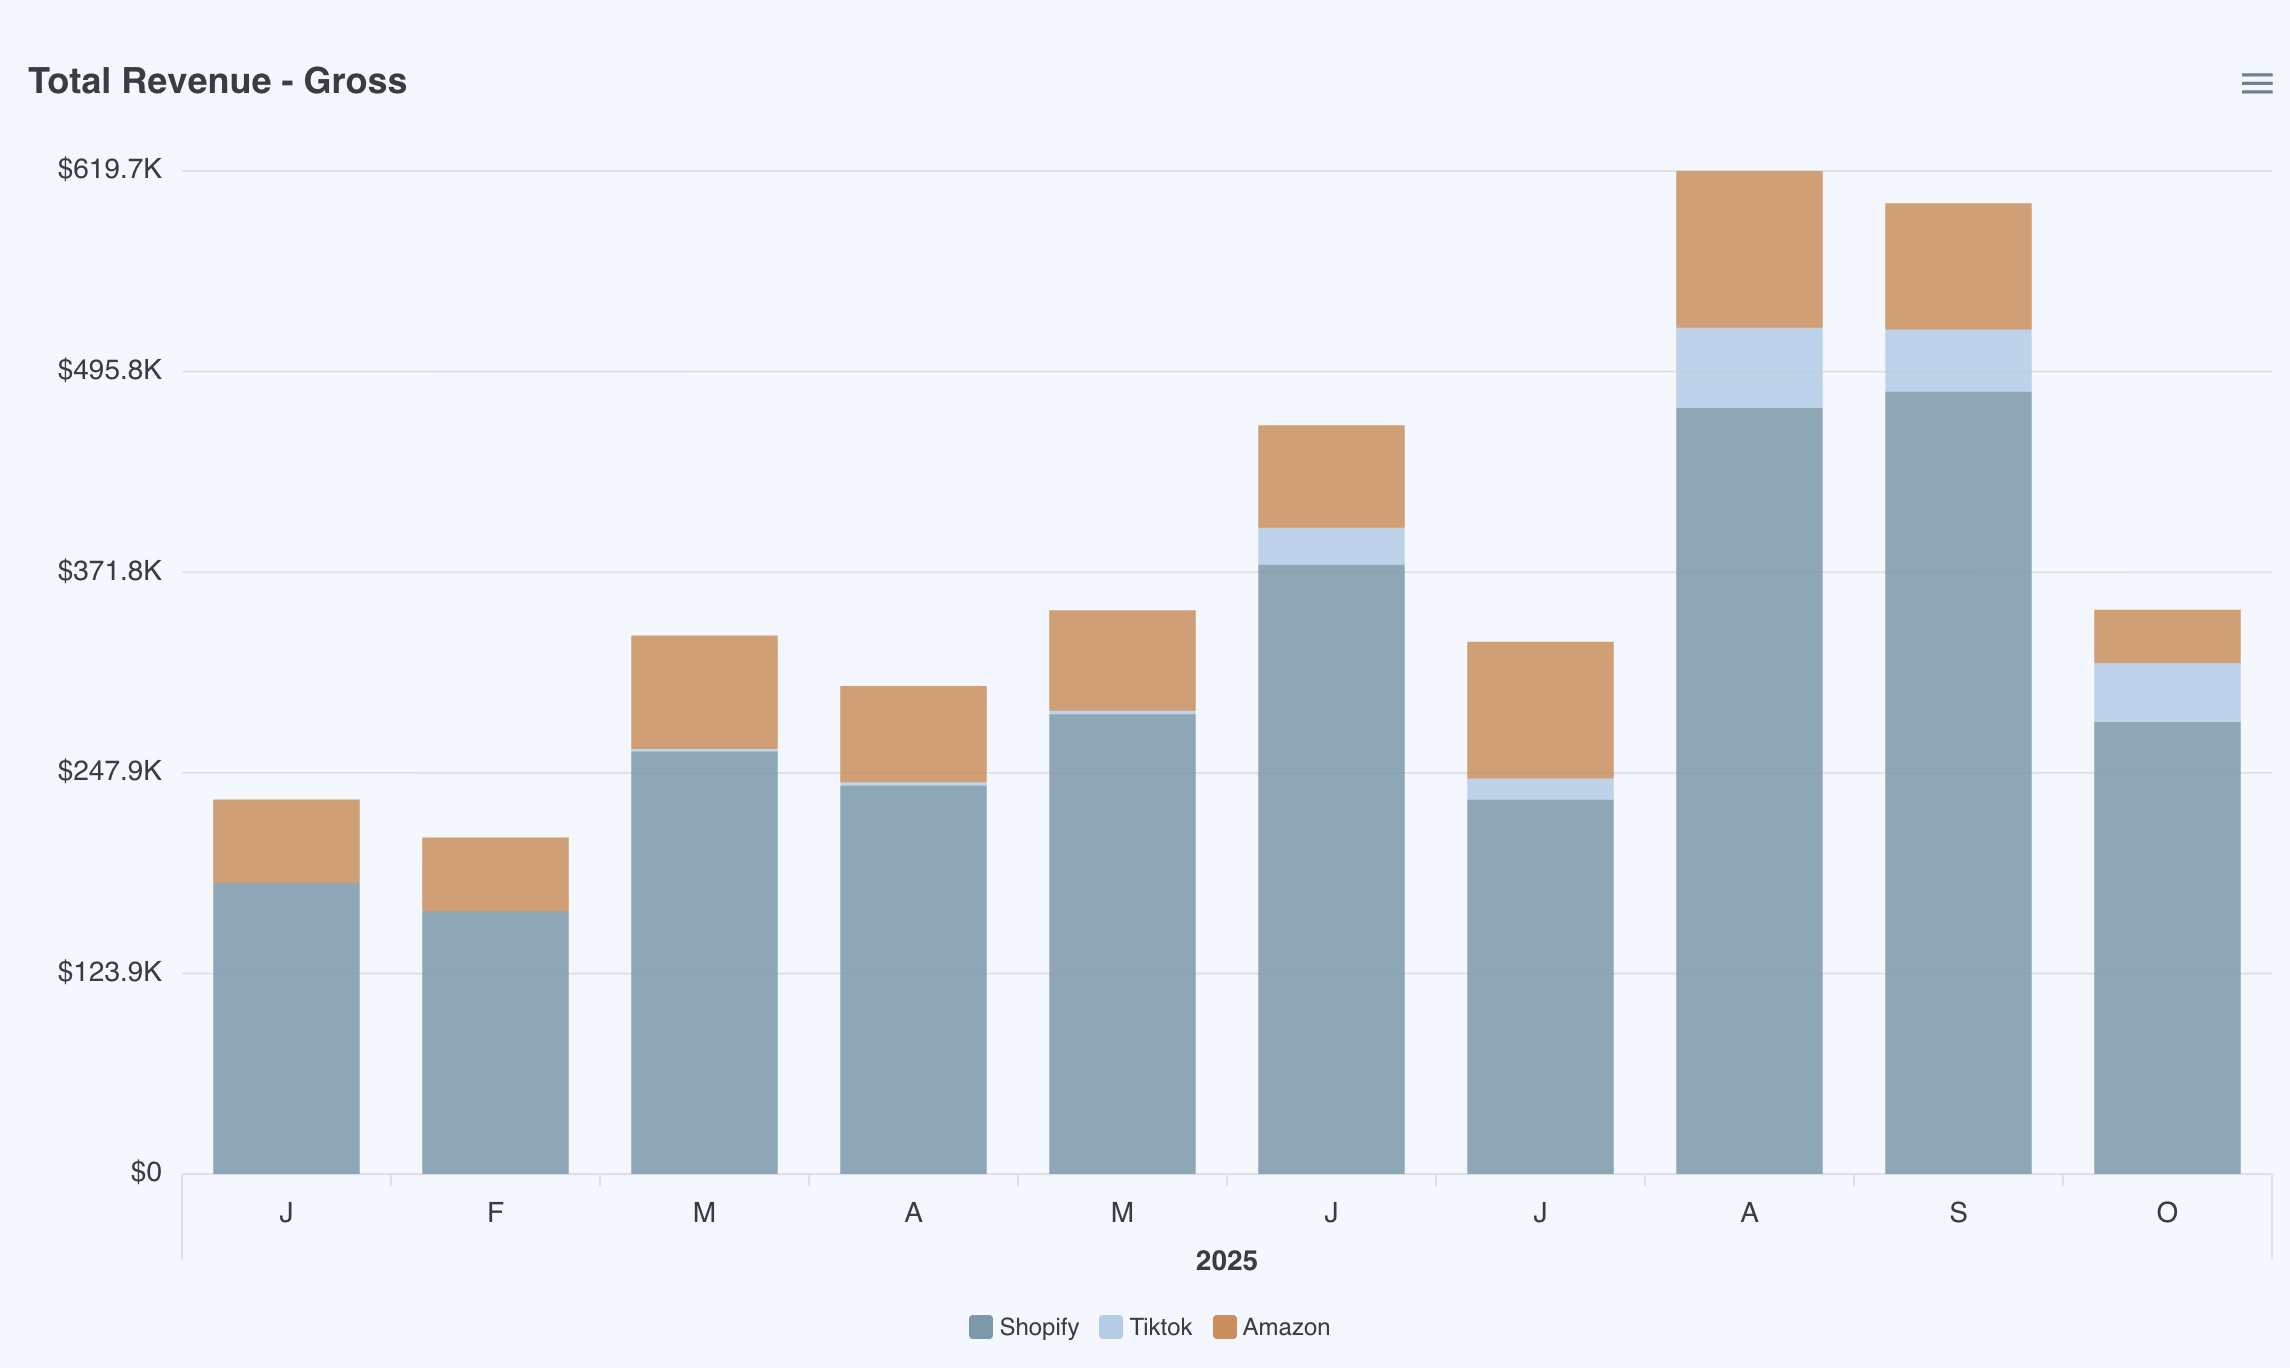
P&L
Track gross and net revenue trends over time.

Balance Sheet
Assess whether your assets, liabilities, and cash position are setting you up to scale.
Real data. Real clarity. In real time.
The Bottom Line
You can’t manage what you can’t measure — and with Vornoy, you’ll never have to. Your business deserves a clear view of what’s really happening. Vornoy gives you that visibility, all in one place.