
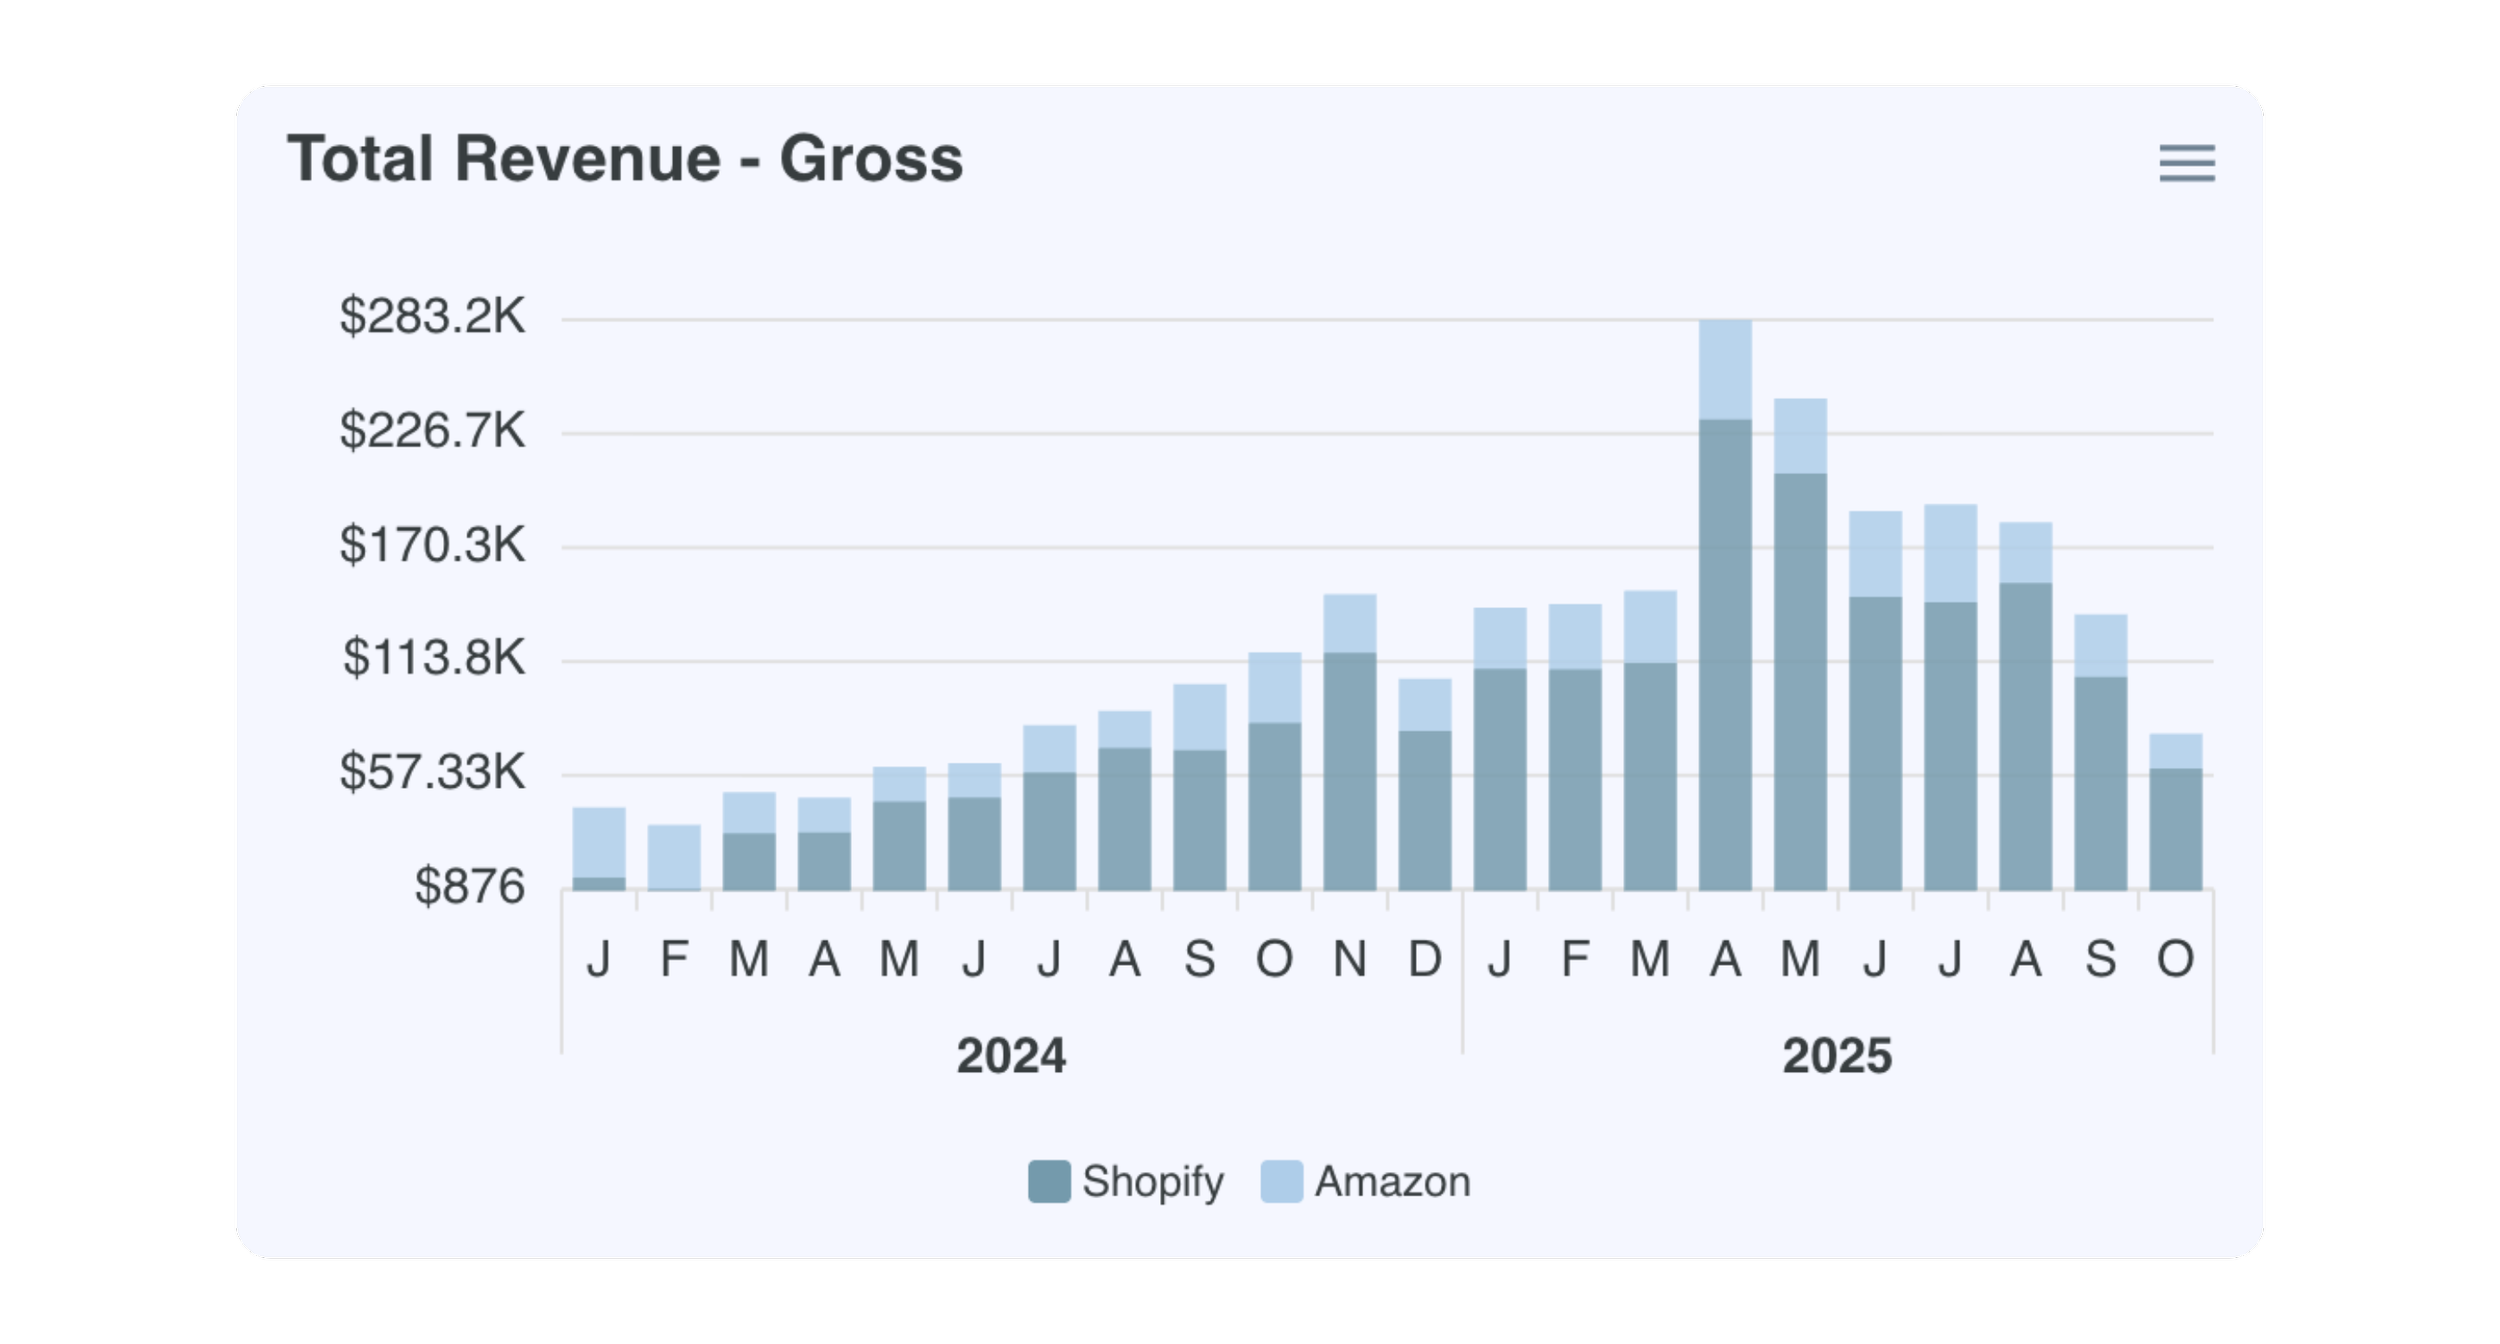
Marketing
Marketing without data is noise and marketing without monitoring is a recipe for disaster. Vornoy gives you the clarity to amplify what works and cut what doesn’t — so every dollar you spend works as hard as you do.
Understand your company’s Marketing better.
Because Guesswork Isn’t a Strategy.

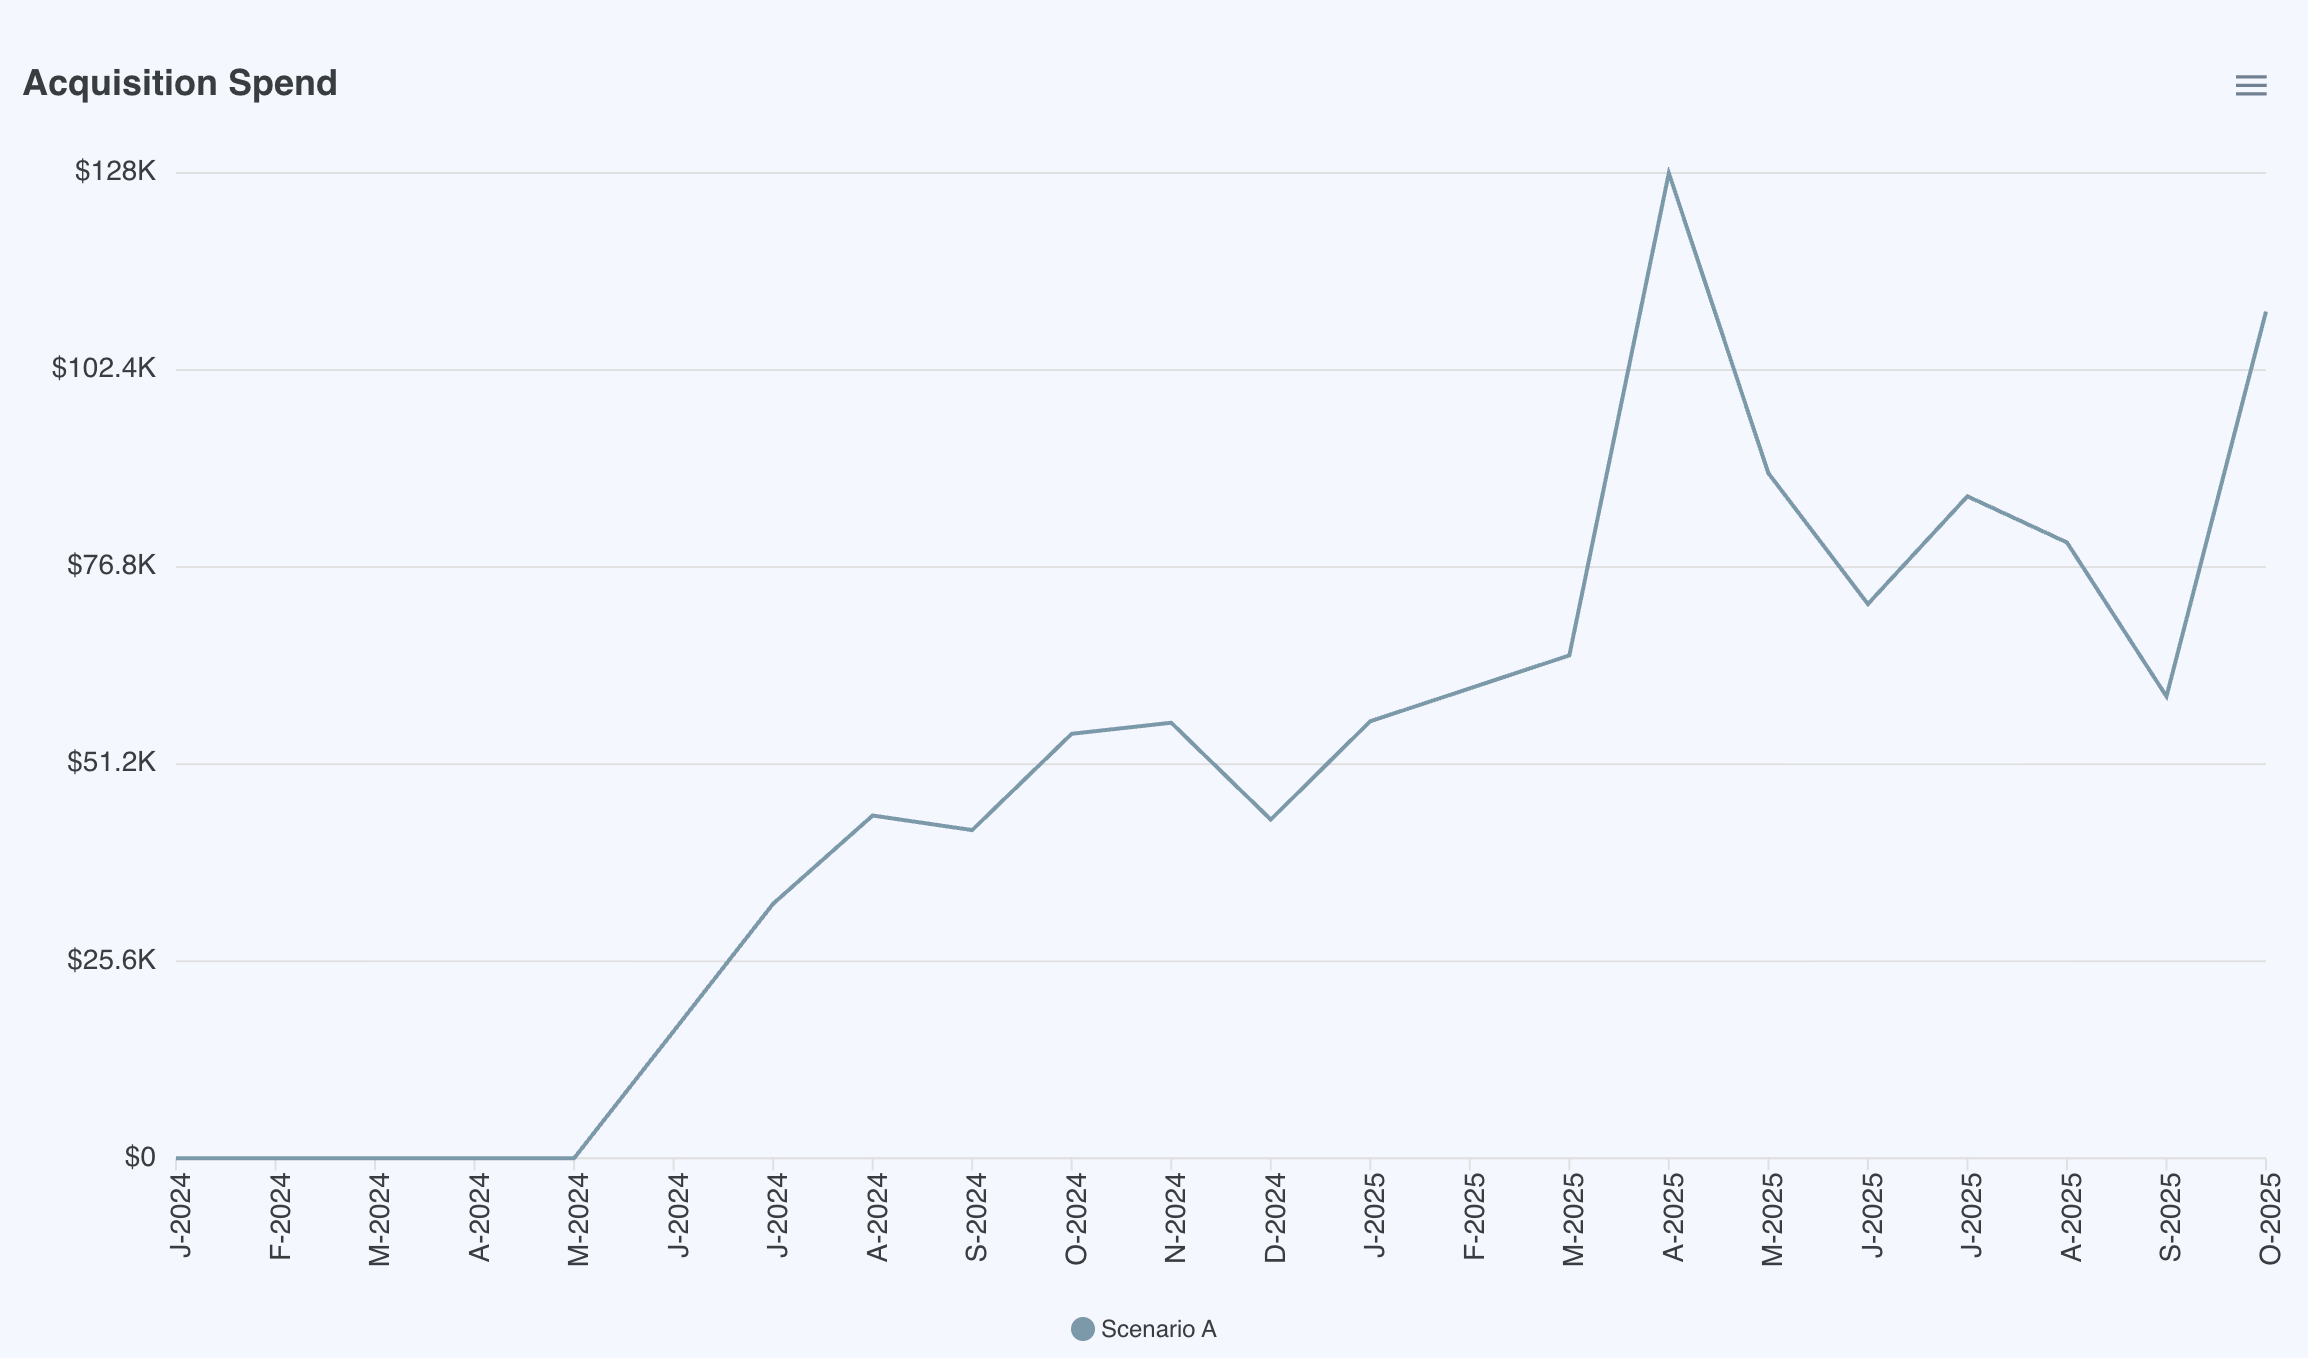
Spend
See how your marketing budget is being used and where it’s overperforming or underdelivering.

Customer Acquisition Cost (CAC)
Know what it truly takes to win a customer.
Return of Ad Spend (ROAS)
Track the return on every campaign in one place.
Real data. Real performance. In real time.
The Bottom Line
You can’t manage what you can’t measure — and with Vornoy, you’ll never have to. Your business deserves a clear view of what’s really happening. Vornoy gives you that visibility, all in one place.